Reports by campaign
Reports by campaign bring together one month of audits to show volume, quality, approval, errors, and change over time. Use this view to understand the overall operation before drilling down to specific operators, calls, or chats.
The report separates Calls and Chats because each channel has its own sources, volumes, and metrics.
Access the report
From the sidebar, open Reports > Campaigns.

The screen shows the channels enabled for your user. The campaign list also depends on your permissions and on the campaigns available for the selected channel. See I cannot see an option the manual mentions.
Generate the report
- Choose Calls or Chats.
- Select the Month.
- Choose the Campaign.
- If you need to analyze a specific scorecard and the selector is available, choose its Active version.
- Click Get report.
When you switch channels, AuditorIA uses the corresponding campaign list. A call campaign is not automatically reused as a chat campaign.
If the campaign has only one version or does not use versioning, the version controls may be disabled.
Read the main indicators
The first cards answer four questions:
| Question | Indicators |
|---|---|
| How much was audited | Total Audited and, for calls, ingested and audited minutes. |
| What was the quality level | Average Quality and the high, medium, and low quality distribution. |
| How many cases passed | Approval Rate, Compliant, and Non-Compliant. |
| Where is the greatest risk | Critical Errors, failed criteria, and operators with the most failures. |
Average Quality averages audit scores. Approval Rate shows the proportion of audits that met the campaign's approval conditions. They should not be interpreted as the same measure.
Call indicators
For Calls, the report adds audio-volume indicators:
- Total ingested minutes: total call duration received for the campaign.
- Total audited minutes: audio included in audits.
- Automatic and Manual: separate audits performed by the system and by a person.
- Validated minutes: the portion of audited audio that has already been validated.
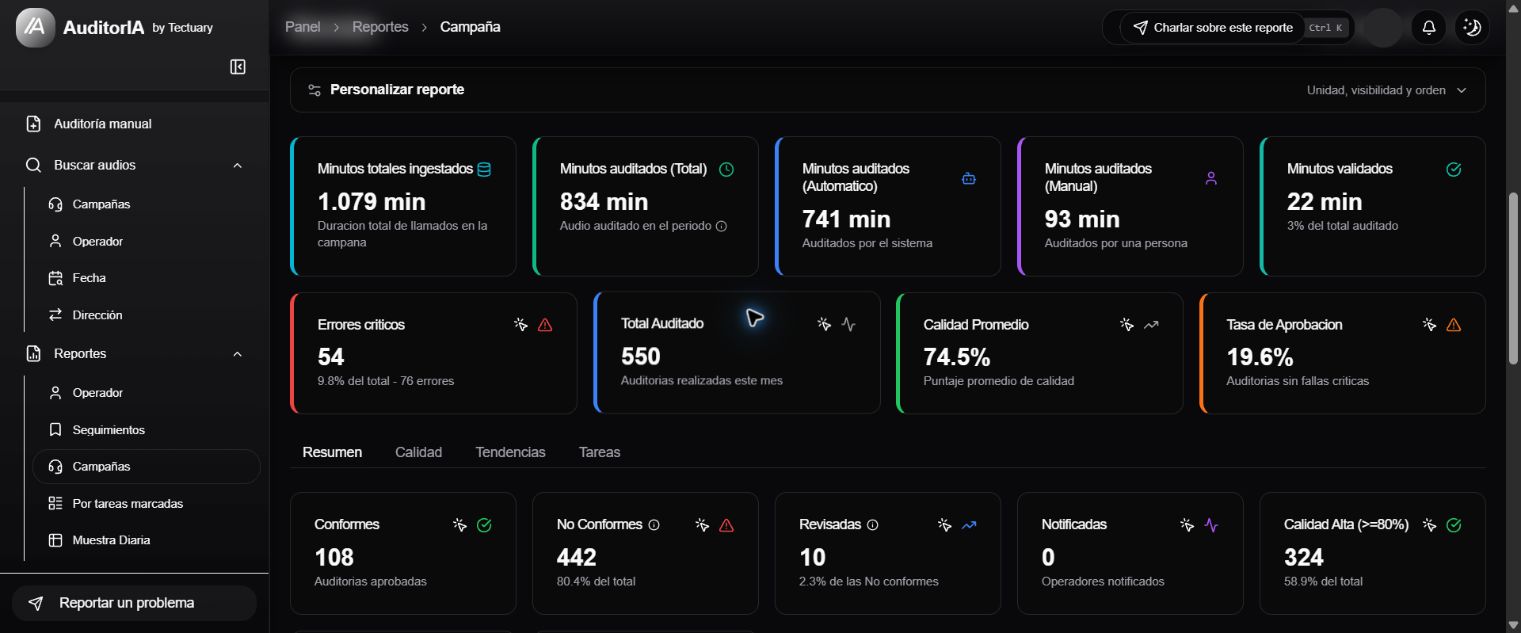
Read volume and quality together. A strong variation based on few audits or few minutes needs more context before you make a decision.
Chat indicators
For Chats, minute cards are replaced by written-channel indicators:
- Audit coverage: relationship between audited chats and chats available in the month.
- Unaudited chats: conversations that do not yet have an associated audit.
- Average messages and Average duration: help size conversations when the source provides those values.
- Critical per 100 audited: normalizes chats with critical errors by audited volume.
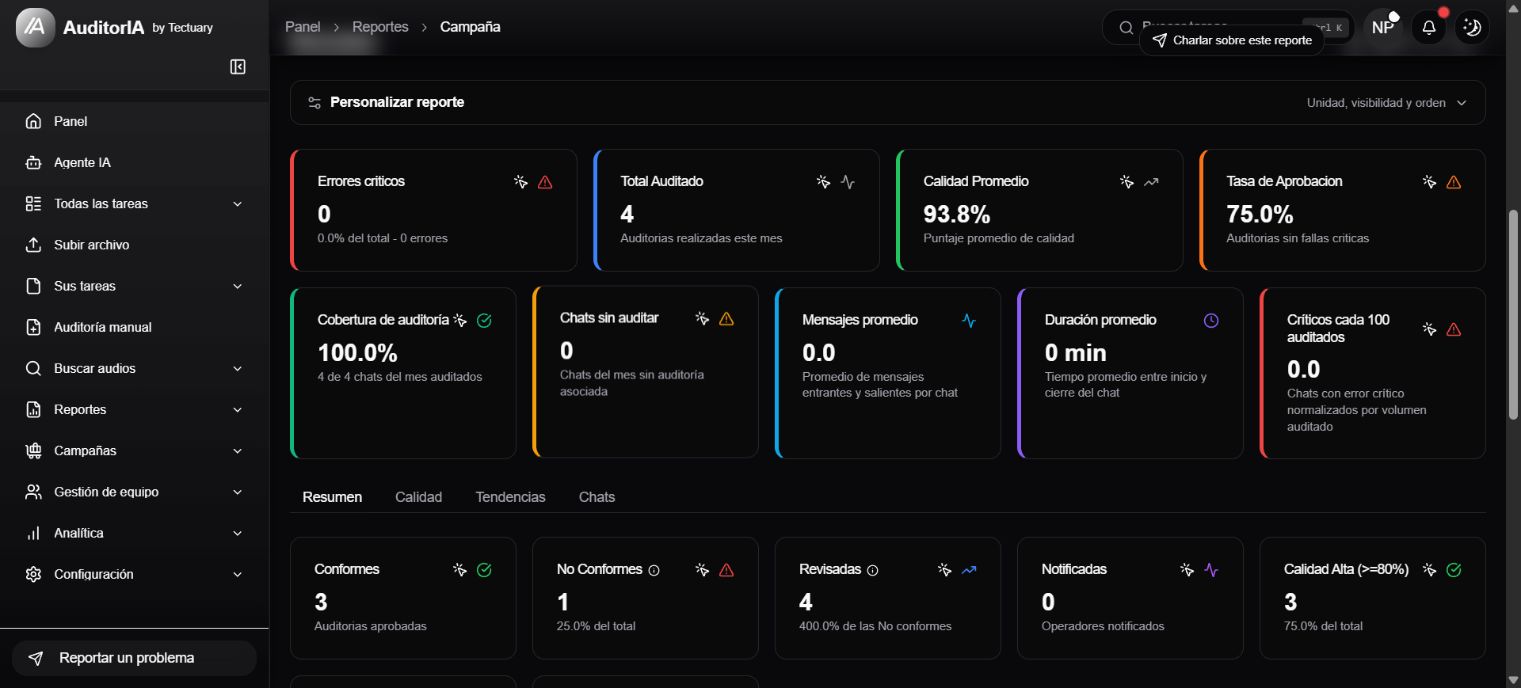
Read coverage together with quality. A good score from a small sample does not necessarily describe the whole operation.
Focus the analysis by day
When the report has data, Days of the month appears. Each day shows its audit count, and days without data are disabled.
Select one or more days to focus the cards, charts, and summary panels on that subset. Use Clear to return to the full month.

Use this filter to investigate a specific workday, an operational change, or a spike in the trends.
Use the report tabs
Summary
Summary combines detailed metrics with two operational views:
- Operators with the most errors ranks people who concentrate the most non-compliant audits. Check volume and error rate before prioritizing an action.
- Most Failed Critical and Non-Critical Criteria shows where scorecard failures repeat.
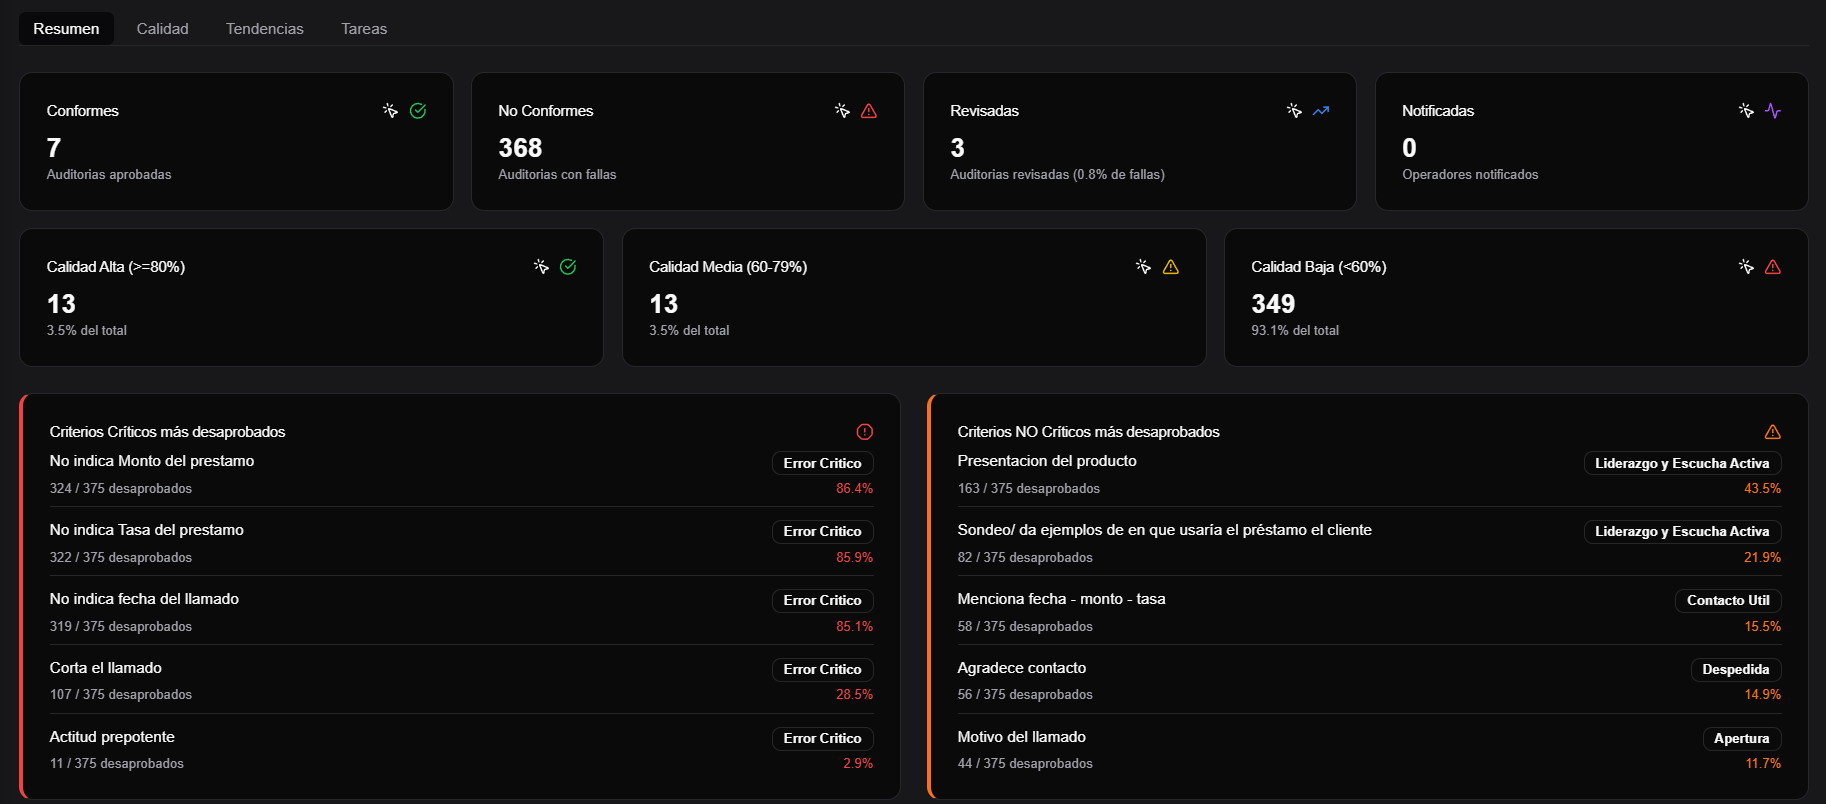
Use failed criteria to guide reviews, coaching, or process adjustments. Before generalizing, confirm how many audits were counted.
Quality
Quality shows:
- Failure Distribution by Criterion, to detect concentrated failures;
- Quality Score Distribution, to see how scores are spread across the sample.
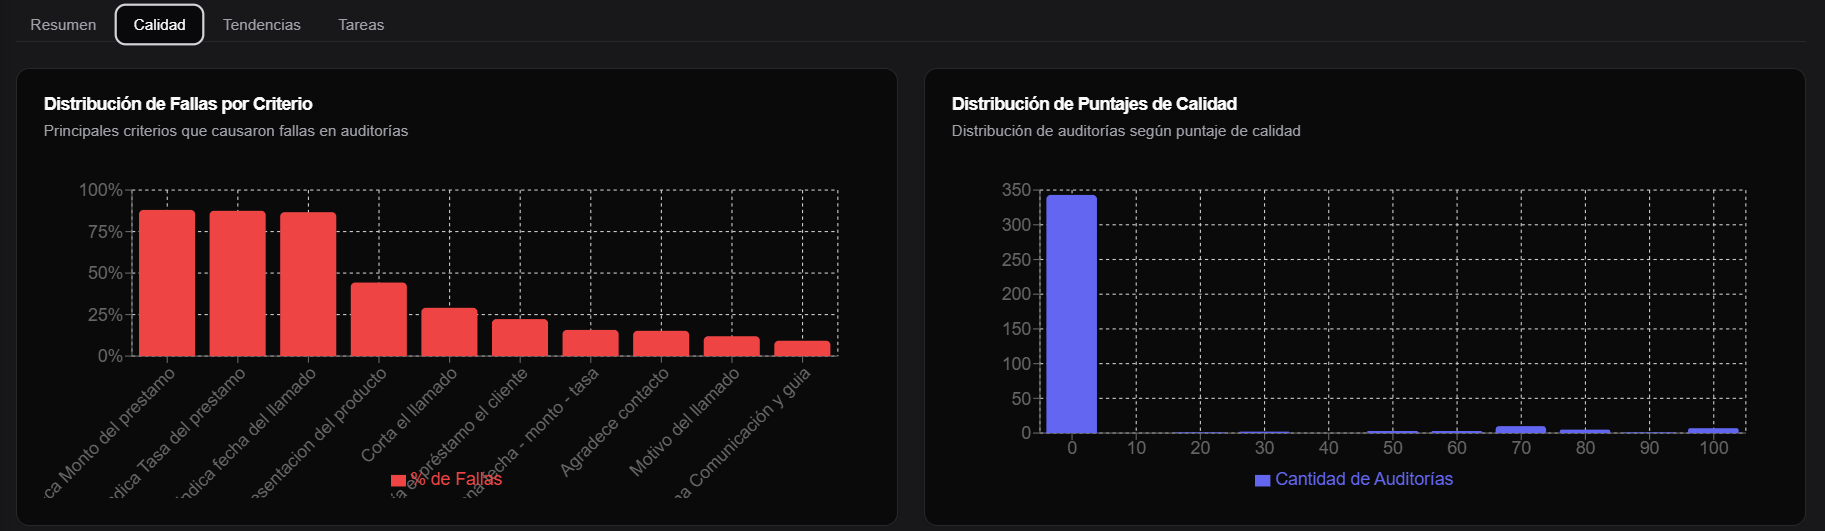
An acceptable average may hide groups of very high and very low audits. Use the distribution to recognize that spread.
Trends
Trends shows change over time for average score, approval, and compliant and non-compliant audit volume.
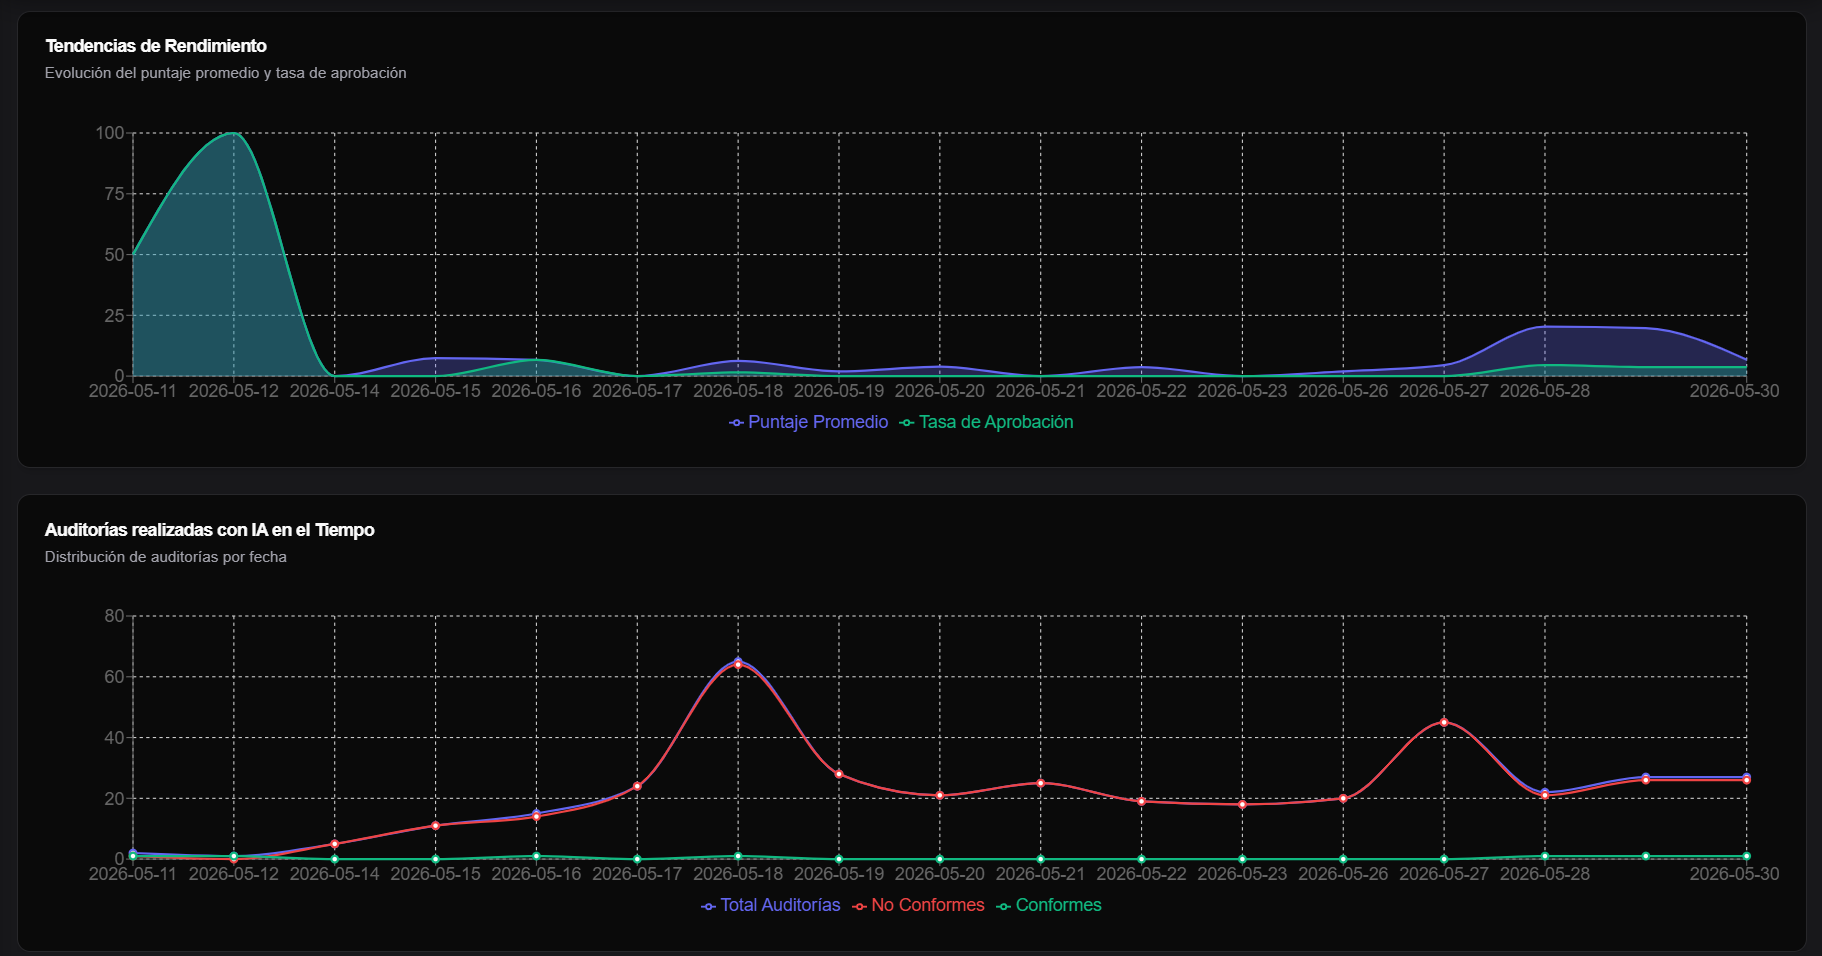
Read each variation together with the volume for that day or week. Extreme percentages are less representative when the sample is small.
Tasks or Chats
The last tab depends on the channel:
- Tasks lists calls for the campaign and month. You can search, add filters, sort columns, and open a task to review its status and audit.
- Chats lists written-channel conversations. You can search and open a chat's detail.
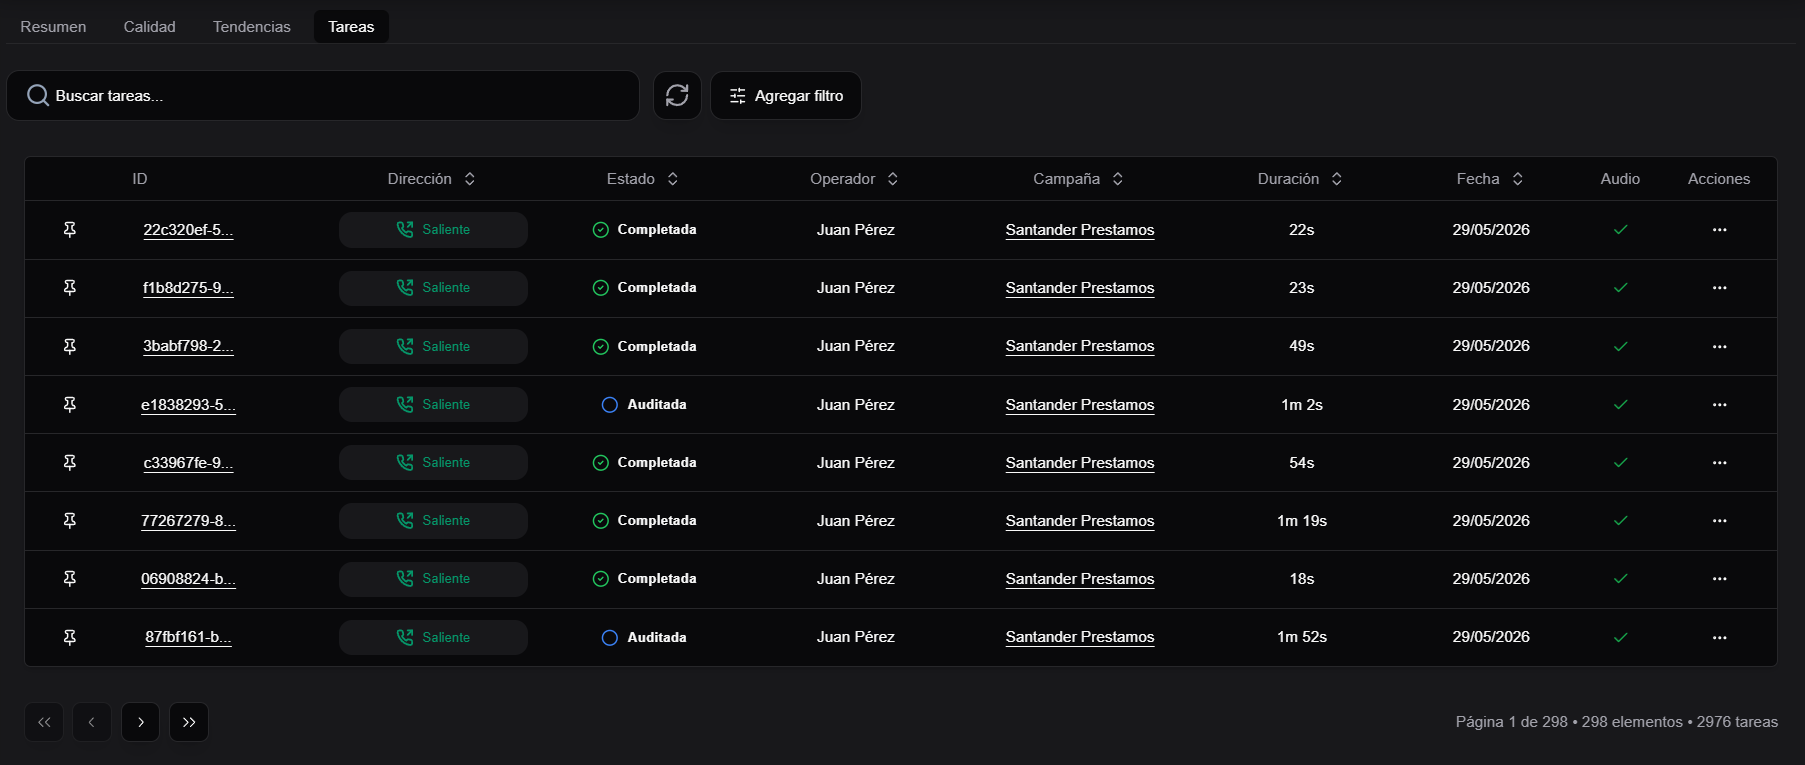
Use the Status column to distinguish audited cases from other operational records.
Customize the view
If Customize report is enabled for your user, you can adapt the reading without changing the data:
- show or hide cards;
- change card order;
- show or hide summary panels;
- choose the time unit for call cards.
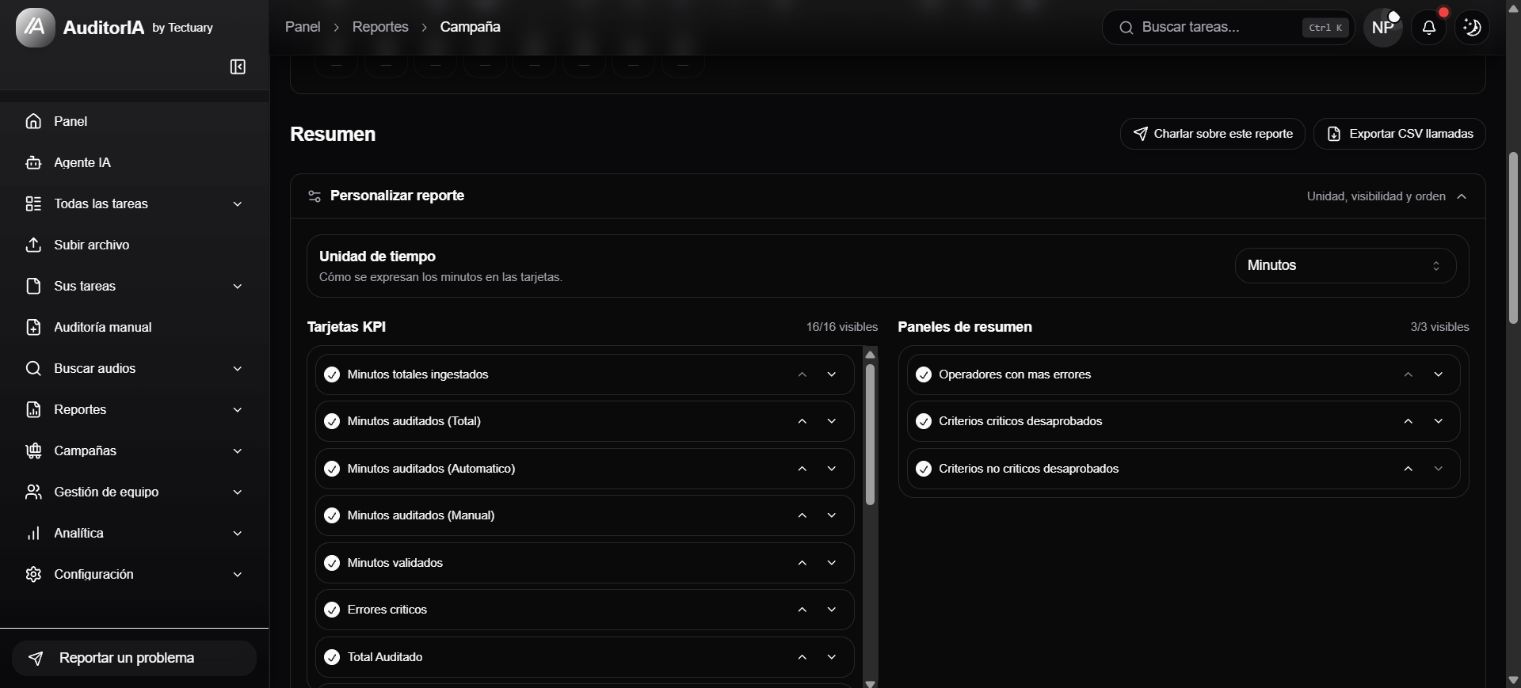
The preference is stored for your user and by channel, so calls and chats can keep different layouts.
Work with scorecard versions
When a campaign has multiple versions, Active version lets you focus the metrics on audits evaluated with a specific version.
Use this filter to avoid mixing results after scorecard criteria or approval conditions changed. To formally compare several versions and control the volume of each one, continue with Quality scorecard versions.
Export the result
Click Export calls to CSV or Export chats to CSV to download records for the selected channel, month, and campaign.
Before sharing the file, check that the form shows the channel, month, and campaign you intended to analyze.
Chat about the report
Chat about this report opens the AI Agent with the general context of the campaign, channel, month, and selected days.
Use it to request a summary, explore a variation, or prepare questions. Confirm the underlying cases from Tasks or Chats before taking operational action.
To learn other ways to attach context and continue a conversation, see Use the AI Agent.

If no results appear
Check:
- that you selected the correct channel;
- that the campaign belongs to that channel;
- that the month contains audits;
- that you still have access to the campaign and report type.
If the campaign is missing from the selector, ask for its access or assignment to be reviewed. If it is available but the period has no data, try another month.
Good practices
- Check volume and coverage before interpreting percentages.
- Use failed criteria to find patterns, not to assign a cause without opening cases.
- Compare periods with equivalent samples.
- Keep calls and chats separate: their metrics represent different types of interactions.
- Open specific tasks or chats before defining coaching, process changes, or follow-up actions.