Explore the main screen
The dashboard is the first screen you see in AuditorIA. It helps you get oriented, check key indicators at a glance, and access the main workflows: tasks, audio, audits, reports, quality settings, and team management.
Not every user sees exactly the same content. The sidebar, widgets, and quick actions depend on your permissions, assigned campaigns, and deployment configuration. See I cannot see an option the manual mentions.
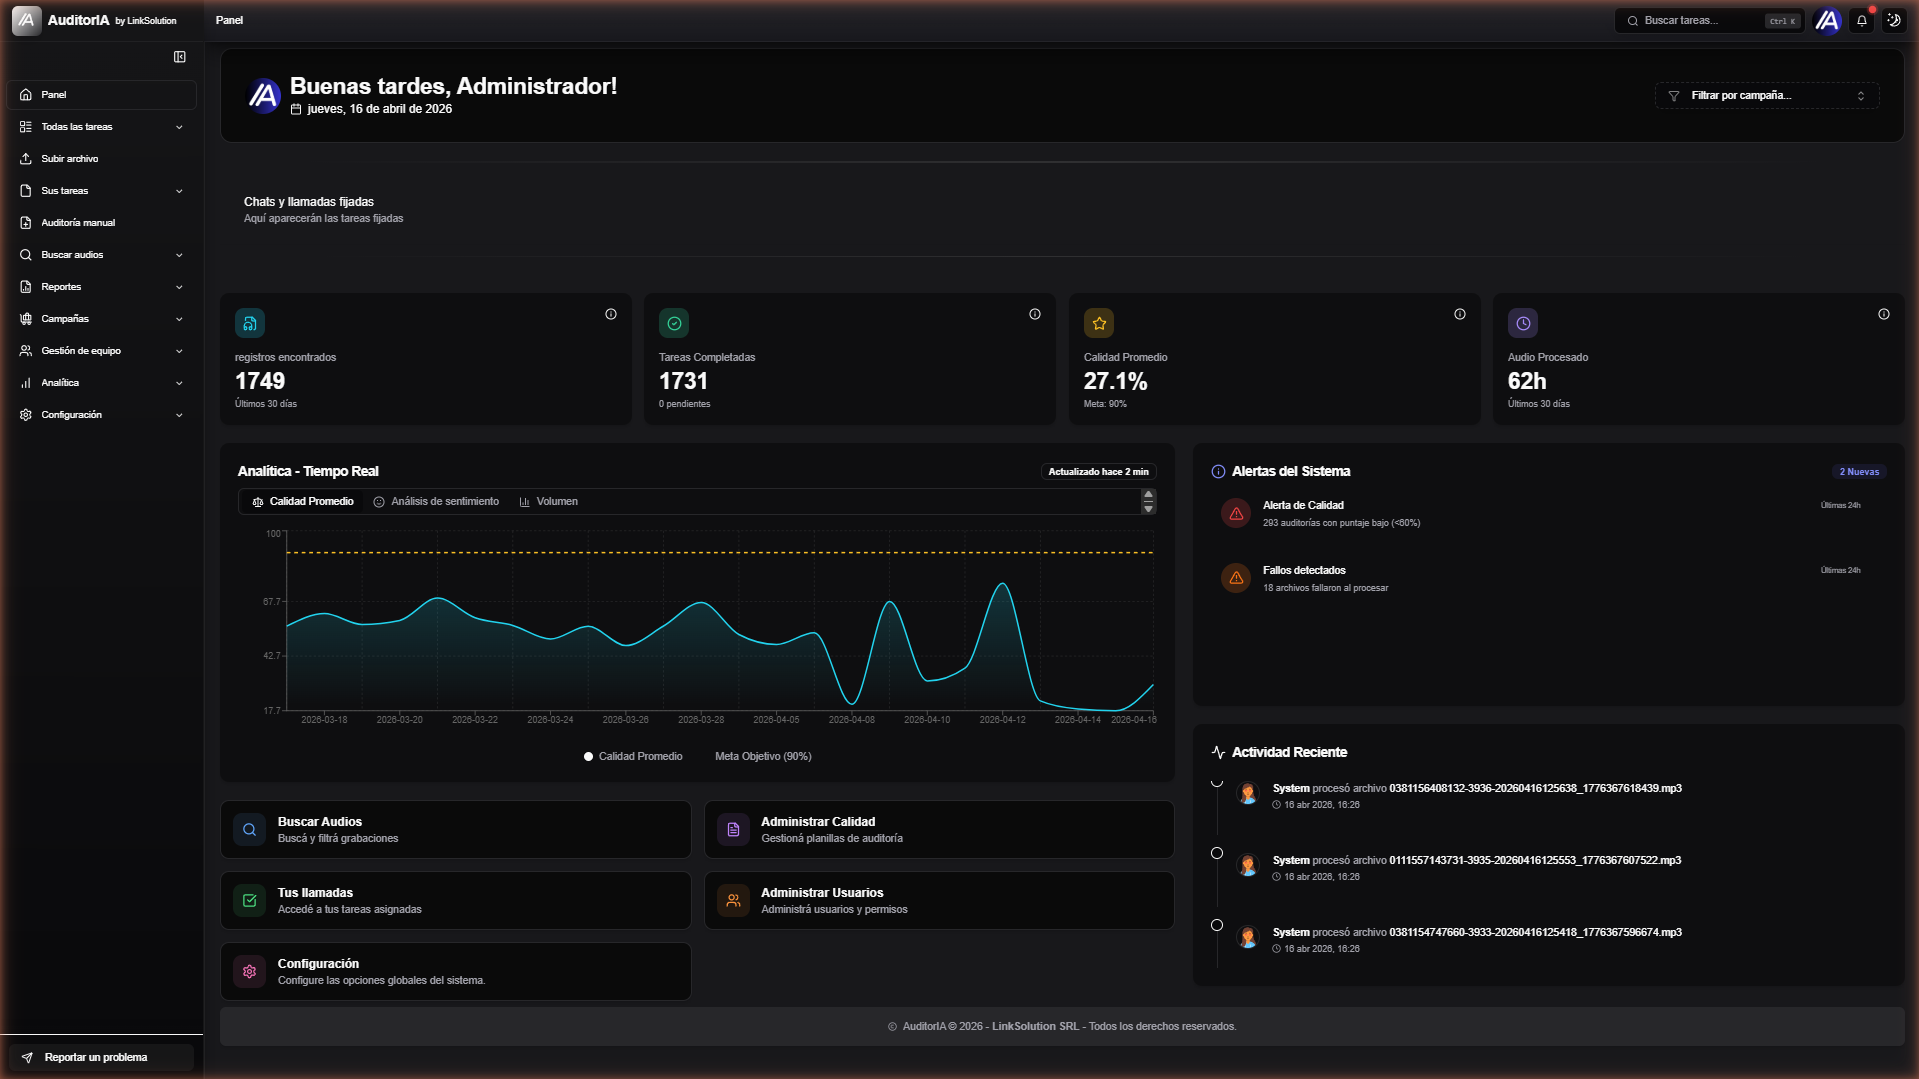
What to check first
When you sign in, review these areas:
| Area | What it is for |
|---|---|
| Sidebar | Access tasks, audio, reports, campaigns, team management, and the settings available to your user. |
| Search bar | Quickly find tasks when you know a detail about the case. |
| Notifications | View pending notifications or notices related to your work. |
| Profile | Open user settings, product updates, language options, and sign out. |
| Campaign filter | Limit dashboard widgets and panels to one or more campaigns. |
| Pinned tasks | Quickly return to calls or chats that you marked for follow-up. |
| Widgets/KPIs | View volume, quality, errors, queue status, activity, or other enabled indicators. |
| Quick actions | Jump to Search audio, Manage quality, Your calls, Manage users, or Settings, depending on your permissions. |
Sidebar navigation
The sidebar is the application's main navigation map. It may include:
| Section | When to use it |
|---|---|
| Dashboard | Return to the dashboard. |
| AI Agent | Query information, analyze results, prepare reports, or propose changes through a conversation. |
| All tasks | Review the calls or chats available within your scope. |
| Upload file | Upload audio files and create transcription/audit tasks. |
| Your tasks | View cases assigned to you, including past, pending, or pinned tasks. |
| Manual audit | Create a manual audit without uploading a new audio file. |
| Search audio | Find recordings by campaign, operator, date, direction, or other details. |
| Reports | Analyze results by operator, campaign, sample, marked task, skill, or scorecard version. |
| Campaigns | Configure campaigns, channels, scorecards, alerts, processes, and sources. |
| Team management | Manage users with access, local operators, roles, and permissions. |
Advanced sections such as Analytics or Settings may also appear. These areas depend on the user's profile and are not part of every user's standard workflow.
If a section is missing, do not assume that the app has failed. You may be missing a permission, an assigned campaign, a specific feature, or the operator ID required for that workflow. See I cannot see an option the manual mentions.
Dashboard widgets and data
The dashboard is assembled from the widgets enabled for your user. It may show KPI cards, charts, alerts, recent activity, and quick actions.
Examples of available widgets include:
- records found;
- completed or pending tasks;
- average quality;
- audio processed;
- tasks with errors;
- pending queue;
- analytics charts;
- alerts panel;
- recent activity.
Use these widgets for an initial overview. For a more detailed analysis, open the corresponding report or list.
The indicators do not necessarily cover the same period. Each card identifies its scope when relevant, such as the last 30 days, the last 24 hours, recent activity, or the current state of a queue.
Campaign filter
The campaign filter limits the information displayed on the dashboard. It is useful when:
- you have access to multiple campaigns;
- you want to review the status of a specific operation;
- the KPIs appear to combine data from different contexts;
- you need to compare dashboard data with a report.
If you are an administrator or have broad visibility, the dashboard may show more campaigns than a user with a restricted operational scope can see.
Quick search
The top search bar lets you find call tasks without browsing through every list. You can search by ID, file name, campaign, or operator. Enter at least two characters and use the status, campaign, operator, and file details to select the correct result.
You can also use Ctrl + K or Cmd + K to open quick search when it is available. To find chats or combine status, date, campaign, or operator filters, use the full lists.
For searches with the full set of filters, see Search and work with tasks.
Choose your next step
| If you want to... | Continue with... |
|---|---|
| Upload an audio file | Upload audio |
| Find a call, chat, or audio file | Search and work with tasks |
| Review an audited call | Review a call audit |
| Review a chat/social media conversation | Review a chat audit |
| Create a manual case | Manual audit |
| View aggregated operator results | Reports by operator |
| Configure evaluation criteria | Quality scorecards |
| Manage access | Manage users with access |
| Query or analyze information with AI | Use the AI Agent |
If your screen looks different
Differences may be caused by permissions, assigned campaigns, deployment configuration, or the distinction between calls and chats/social media conversations.
Before escalating the issue:
- confirm which user account you are signed in with;
- check that you are in the correct campaign;
- verify whether the section is available to your role;
- check I cannot see an option the manual mentions;
- if it is still missing, see Common issues.